HTML Graphics 📌
In this lecture, we are going to discuss about how to create Graphics in html.
There are two modern web technologies for creating rich drawn graphics within the browser:
- Canvas
- Scalable Vector Graphics (SVG).
- Canvas
A hypertext markup language element introduced in HTML5 for creating and analyzing bitmap images as pixels. The Canvas specification provides a Javascript API for accessing the element's graphics context and performing drawing operations with it.
The HTML <canvas> element is used to draw graphics, on the fly, via scripting (usually JavaScript). The <canvas> element is only a container for graphics. You must use a script to actually draw the graphics.Canvas has several methods for drawing paths, boxes, circles, text, and adding images.
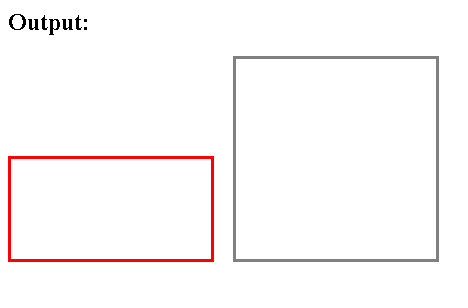
Below is an example of Canvas Tag in html:
    <canvas id="myCanvas" width="200" height="100" style="border:3px solid red;">
    <canvas>

    <canvas id="myCanvas" width="200" height="200" style="border:3px solid  grey; margin-left:15px">
    <canvas>
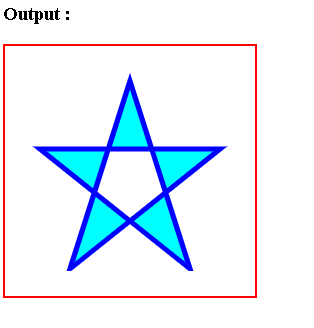
- SVG
HTML SVG is a modularized language which is used to describe graphics in XML. It describe two-dimensional vector and mixed vector/raster graphics in XML. It is a W3C recommendation. Since it's an XML files, you can create and edit an SVG image with text editor, but generally drawing programs like inkspace are preferred to create it.
SVG is mostly used for vector type diagrams like pie charts, 2-Dimensional graphs in an X,Y coordinate system etc. The <svg> element specifies the root of a SVG fragment. You can animate every element and every attribute in SVG files.
Below is an example of SVG Tag in html:
<style>
    svg {
    border:2px solid red;
    padding:25px;
    };
</style>

<svg width="200" height="200";>
    <polygon points="100,10 40,198 190,78 10,78 160,198"
    style="fill:aqua;stroke:blue;stroke-width:5;fill-rule:evenodd;"/>
</svg>